Follow every request with OpenTelemetry


A single API call rarely does its work alone. Placing an order might charge a card through a payment provider, publish a message that sends a confirmation email, and queue a Job that fulfils the order on another server a few seconds later. When a customer says their order never arrived, the evidence is spread across three servers, four log files and a payment dashboard, and there's nothing to tie it together.
This is what distributed tracing is for. Each unit of work records a span, every span carries the Id of the trace it belongs to, and the trace follows the work wherever it goes. You open one trace and see everything that request caused, in order, with how long each step took and where it failed.
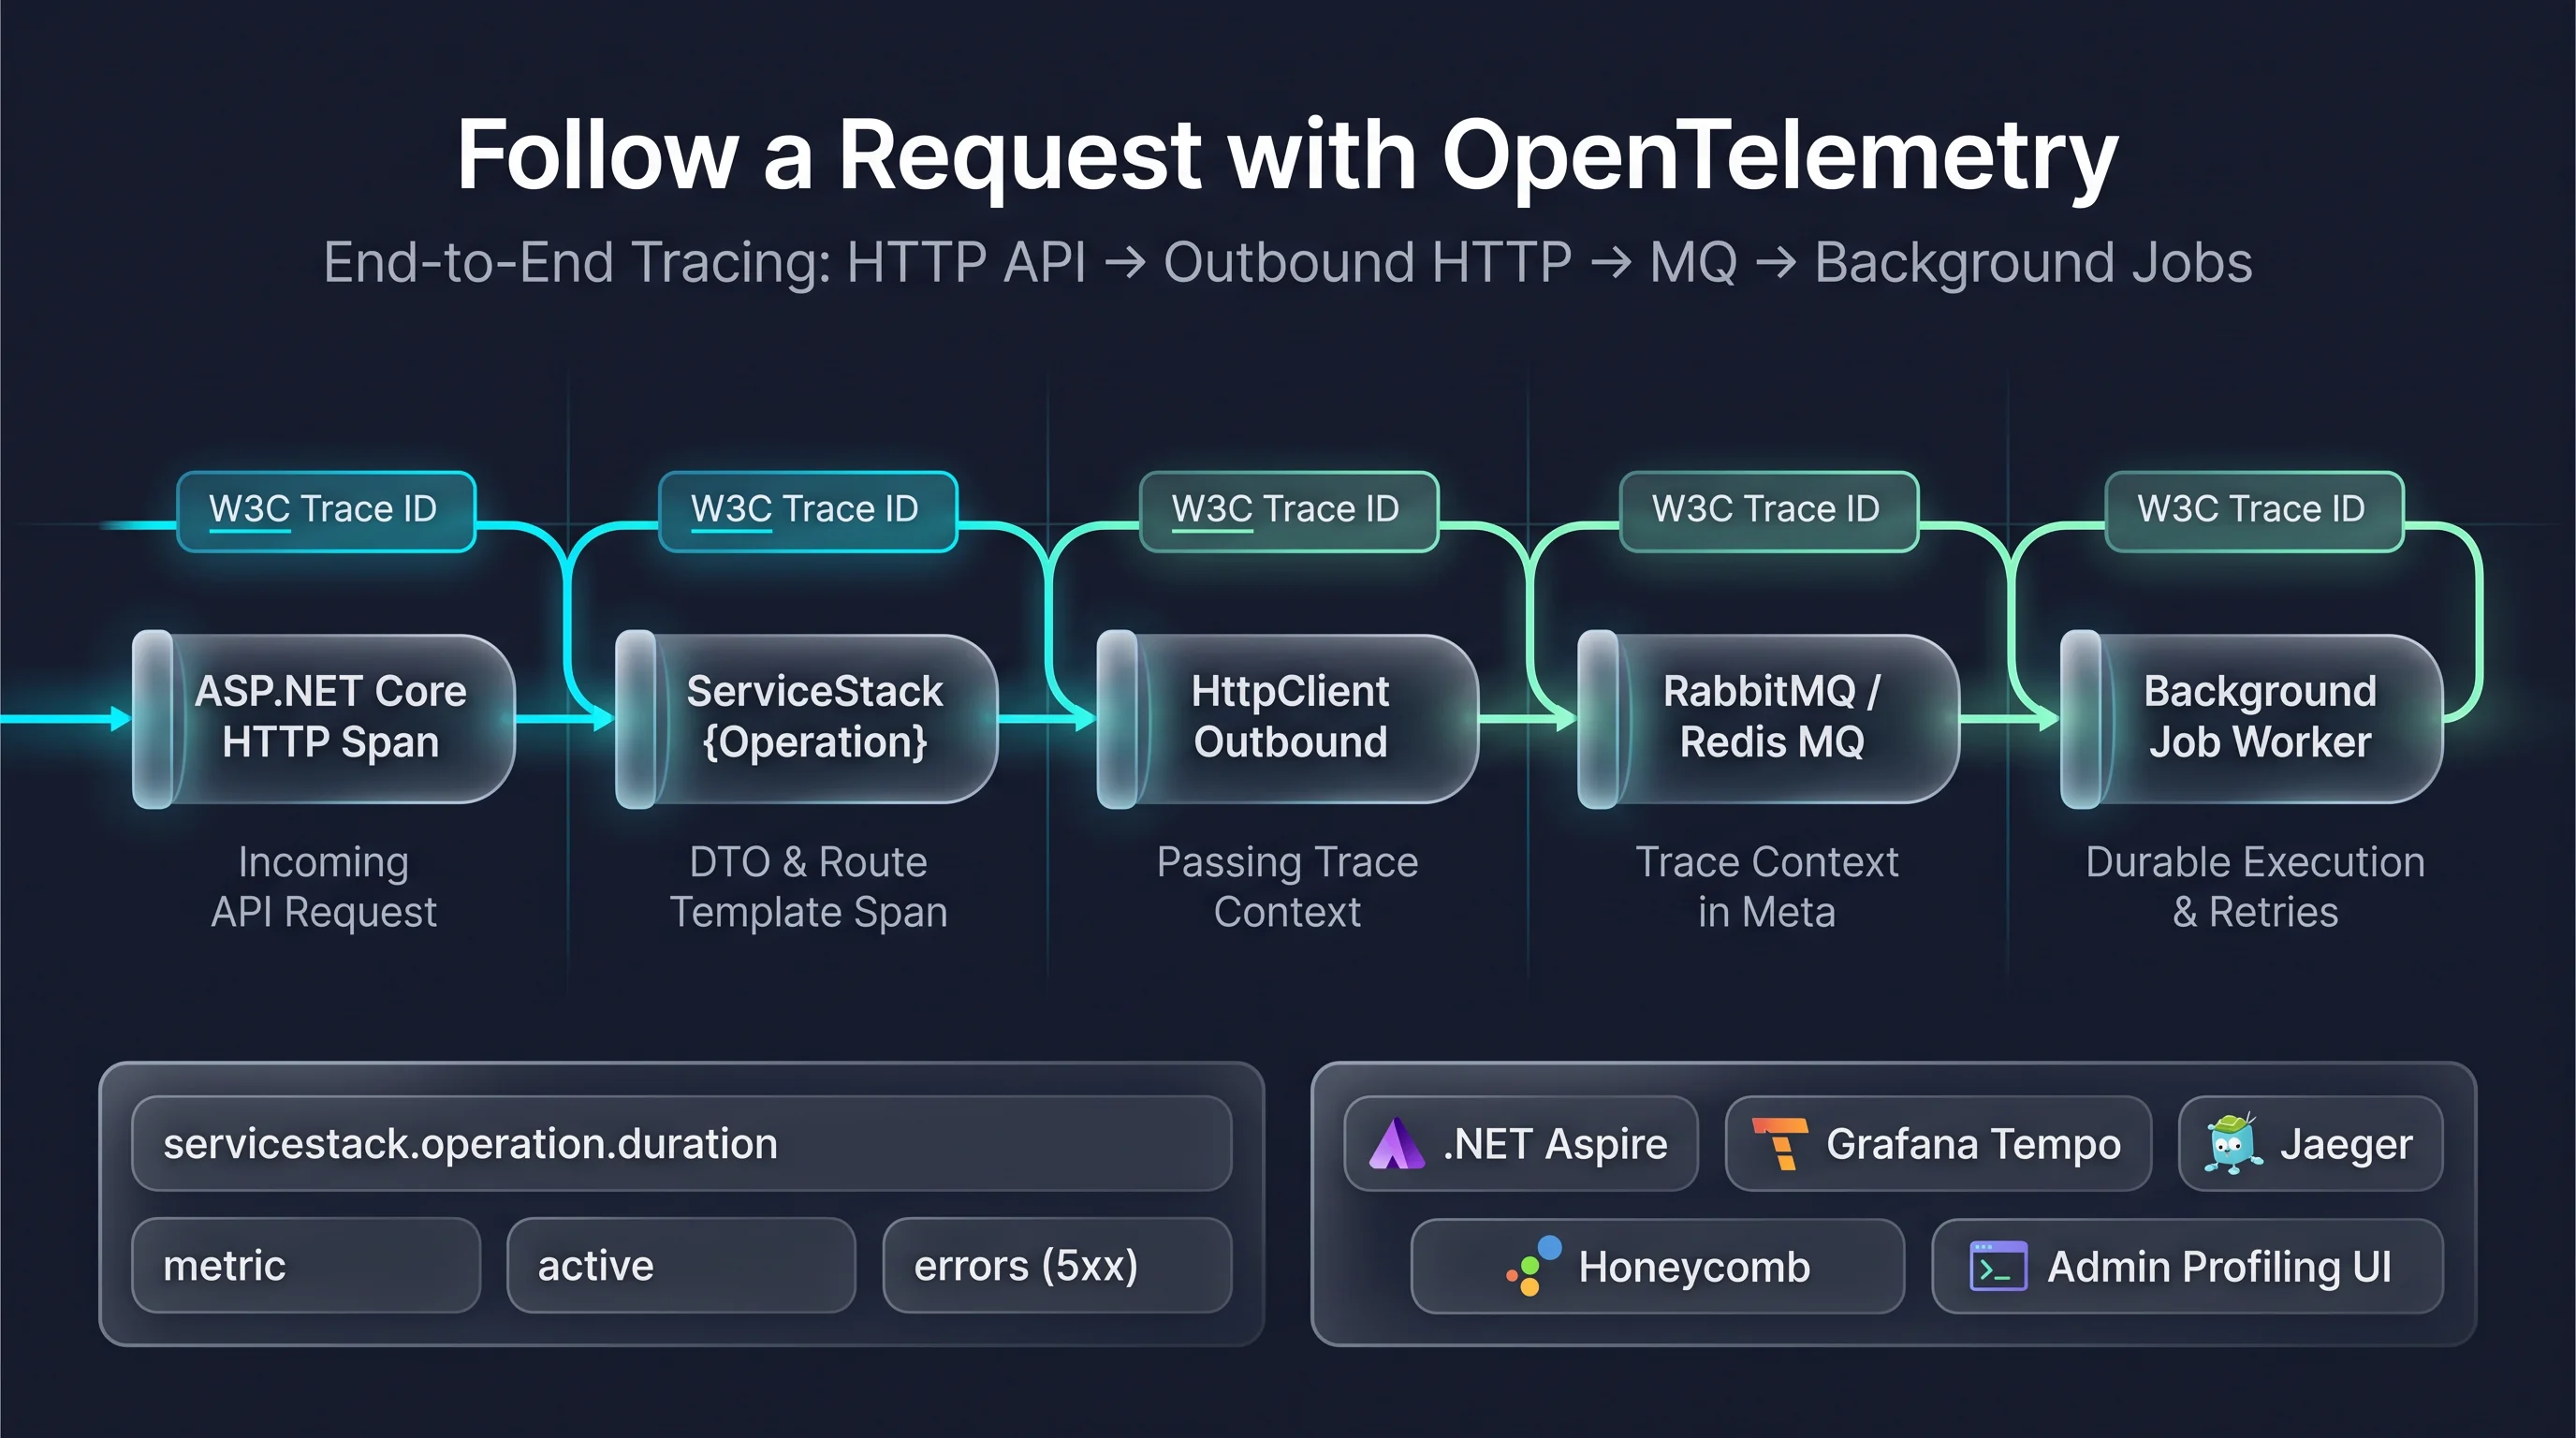
ServiceStack v10.3 now emits standard OpenTelemetry traces and metrics that connect all of it:
- API operations get a span inside ASP.NET Core's HTTP span, tagged with the Request DTO, route and outcome
- MQ messages carry the trace to whichever server processes them, for Background MQ, Redis MQ and RabbitMQ
- Background Jobs continue the trace of the request that queued them, even after a retry
- Metrics you can alert on for API durations, activity and failures, without noisy client errors
- Traces in the Profiling UI, so you can follow a trace without leaving the Admin UI
It all works with the tracing backend you already use: Jaeger, Grafana Tempo, Honeycomb, Datadog, the .NET Aspire Dashboard, or anything else that speaks OTLP.
See the whole request
Here's that order, first as you'd find it in your logs today, and then as a single trace:
The message published on web-1 carries the W3C traceparent in its Meta, so the consumer on worker-2
continues the same trace. The Job queued by PlaceOrder stores the trace in its BackgroundJob.TraceId
column, so when it fails and is retried on worker-3, both attempts show up under the request that started
them. Nothing had to be passed around by hand.
Add it to your App
Add OpenTelemetry to an existing .NET 8+ App with:
npx add-in opentelemetry
This installs the OpenTelemetry packages and adds a Configure.Profiling.cs that registers ASP.NET Core and
HttpClient instrumentation alongside ServiceStack's own sources:
services.AddOpenTelemetry()
    .WithTracing(tracing => tracing
        .AddAspNetCoreInstrumentation()
        .AddHttpClientInstrumentation()
        .AddSource(OperationDiagnostics.Name, MessagingDiagnostics.Name, JobsDiagnostics.Name)
        .AddOtlpExporter())
    .WithMetrics(metrics => metrics
        .AddAspNetCoreInstrumentation()
        .AddMeter(OperationDiagnostics.Name, MessagingDiagnostics.Name, JobsDiagnostics.Name)
        .AddOtlpExporter());
The three ServiceStack sources cover API operations, messaging and Background Jobs, while .NET's own instrumentation covers incoming HTTP requests and outbound HTTP calls.
ServiceStack emits standard .NET ActivitySource traces and Meter metrics and doesn't depend on the
OpenTelemetry SDK. Your App chooses the exporter, sampling and collector, and nothing is recorded until a
listener is registered, so Apps that don't use OpenTelemetry pay nothing for it.
INFO
The opentelemetry add-in includes everything the profiling add-in does. Both create a
Configure.Profiling.cs, so use one or the other.
Point it at your backend
The exporter uses the standard OpenTelemetry environment variables, so the same build can send its traces to a different collector in each environment:
| Variable | Used for |
|---|---|
OTEL_EXPORTER_OTLP_ENDPOINT |
Your collector's OTLP endpoint. Defaults to http://localhost:4317 |
OTEL_EXPORTER_OTLP_PROTOCOL |
grpc (default) or http/protobuf |
OTEL_EXPORTER_OTLP_HEADERS |
Credentials your hosted backend needs, e.g. an API key header |
OTEL_SERVICE_NAME |
The service name shown in your backend. Defaults to your App's name |
OTEL_TRACE_URL_TEMPLATE |
Optional link from the Profiling UI to your backend |
To try it locally without signing up for anything, run the .NET Aspire Dashboard in Docker. It receives OTLP on the default port, so there's nothing to configure:
docker run --rm -it -p 18888:18888 -p 4317:18889 mcr.microsoft.com/dotnet/aspire-dashboard:latest
Open the login link printed in its output, call a few of your APIs, and your traces and metrics appear.
Sampling stays in your hands. For example, to export 10% of new traces while always following the decision of an upstream service:
.WithTracing(tracing => tracing
    .SetSampler(new ParentBasedSampler(new TraceIdRatioBasedSampler(0.1)))
    //...
Metrics you can alert on
Traces tell you what happened to one request. Metrics tell you when something is wrong across all of them. ServiceStack records three metrics for every API:
| Metric | Type | Description |
|---|---|---|
servicestack.operation.duration |
Histogram (s) | How long API operations took |
servicestack.operation.active |
UpDownCounter | API operations currently executing |
servicestack.operation.errors |
Counter | API operations that failed with a server error |
An error alert is only useful if it means your App is broken. A user mistyping their email, a request
without a valid session or a lookup for an order that doesn't exist are all working as designed. So
ServiceStack only counts 5xx responses and unhandled exceptions as errors. Validation and authorization
failures are recorded as client_error and keep an Ok span status. Try it:
Metrics are tagged by operation, HTTP method, route template and outcome, never by raw URLs, users or
request bodies. Every tag has a small, fixed set of values, so your metrics stay cheap to store and fast to
query no matter how many orders you have. Only requests for known APIs are measured, so bots probing
/api/{anything} can't create new metric series either.
The same privacy rule applies to spans: request and response bodies, user ids and exception messages are never added, only the exception type.
The messaging meter adds counts of sent and consumed messages and how long processing took, and these join the existing Background Jobs metrics for queue wait times, retries and failures.
Traces in the Profiling UI
You don't have to leave the Admin UI to follow a trace. With OpenTelemetry registered, the Profiling UI records each event with its W3C Trace Id and Span Id, so the API, OrmLite, Redis, HttpClient, MQ and Job events from the same request come up together. Click a Trace Id to see them in order, and switch between two views:
- Details - the familiar Profiling grid, with each event's full details
- Trace view - one row per step, indented under its parent span, with its source, duration and any errors
Your OrmLite queries and Redis commands now sit right under the API or Job that ran them, and since the selected view is kept in the URL, you can send a teammate a link to the exact trace you're looking at.
The Profiling UI only sees what happened on this server. For the rest of the story, set
ExternalTraceUrlTemplate and the Trace view gets an Open in trace backend link to the complete trace:
services.AddPlugin(new ProfilingFeature {
    ExternalTraceUrlTemplate = "https://traces.example.org/trace/{traceId}",
});
HTTP is also allowed for localhost, so you can link to a local backend during development:
| Backend | ExternalTraceUrlTemplate |
|---|---|
| Jaeger | http://localhost:16686/trace/{traceId} |
| Aspire Dashboard | http://localhost:18888/traces/detail/{traceId} |
Profiling works the same as before without OpenTelemetry, grouping events by their existing request identifiers, so you can adopt tracing whenever you're ready. Profiling durations and times are now also measured correctly on Linux and macOS, where they were previously overstated.
Good to know
- Want more detail inside an API? Set
OperationDiagnostics.EnableDetailedSpans = trueto add spans for request filters, the service invocation and AutoQuery execution. They're off by default to keep the number of spans per request low. - Upgrading is safe. Messages and Jobs without trace context, including those queued before you
upgraded, simply start a new trace instead of failing. The existing
IMessage.TraceIdis unchanged. - Custom MQ clients can join in. Wrap your publish in
MessagingDiagnostics.StartPublish()and callMessagingDiagnostics.Inject(message), and your queue's messages join the same trace. - Sampling doesn't affect profiling. Sampling only changes what's exported. The Profiling UI keeps its own
bounded history, controlled by
ProfilingFeature.Capacity, and metrics are recorded whether or not a trace is sampled.
Get Started
OpenTelemetry support is available in ServiceStack v10.3 for all .NET 8+ Apps. To add it:
- Run
npx add-in opentelemetryin your App - Set
OTEL_EXPORTER_OTLP_ENDPOINTto your collector, or run the Aspire Dashboard locally - Optionally set
OTEL_TRACE_URL_TEMPLATEto link the Profiling UI to your trace backend
See OpenTelemetry Tracing for the full list of spans, attributes and configuration, and the v10.3 Release Notes for everything else in this release, including Scalable Background Jobs and API Rate Limiting.


